Oct. 12, 2020
On-the-fly prediction inundation maps

Inundation maps are crucial tools for short-term and long-term flood preparedness. A timely and cost-effective method of creating inundation maps could assist first responders in allocating resources and personnel in the event of a flood or in preparation of a future disaster. The goal of our project is to develop a web application that can create on-the-fly inundation maps within a 6 to 12 hour prediction window for sites across Canada.
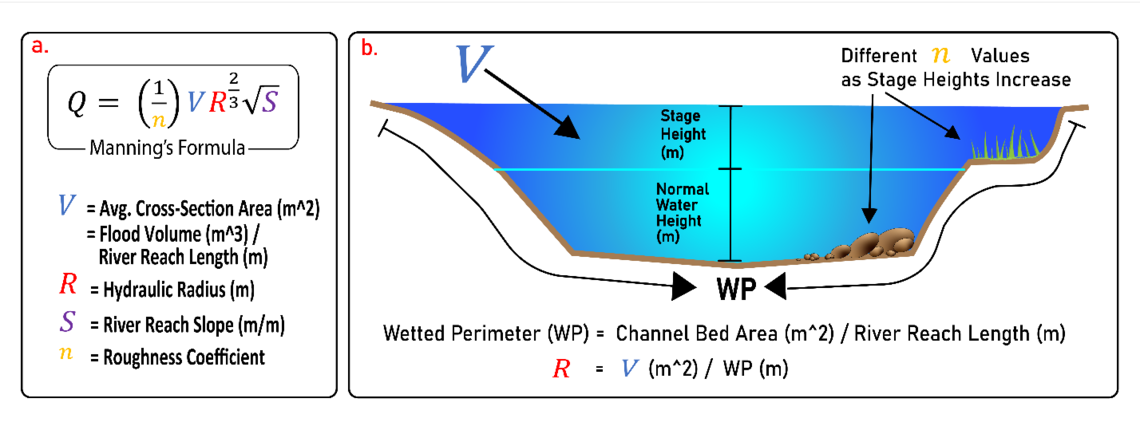
The application will use the Height Above Nearest Drainage (HAND) model to simulate and visualize a flood event. These models have shown strong results in previous Canadian flood simulation studies using minimal data inputs. This low data requirement would allow the app to be widely used across Canada, even in data limited communities. The challenge with HAND models is that they require water level (m) data inputs while many sources of data only provide discharge (m3/sec) data. Thus, the first phase of our project was to find a relationship between these two data types. Synthetic rating curves (SRC), created using river geometry and the Manning’s formula, could provide an approximate water level given a discharge input. A challenge with creating SRCs includes representing how multiple different land covers will slow down flow due to texture and bulky features (i.e. smooth asphalt vs. rocky river channel); this relates to the roughness coefficient (n). In our study, three methods of representing multiple n values were experimented with (a single n method, a weighted average method, and a minimum-maximum method).

Figure 1. The variables incorporated into the Manning's Formula (a.). The geometry of the river and its physical characteristics will influence these variables (b.), specifically the challenge with the roughness coefficient (n) is displayed.
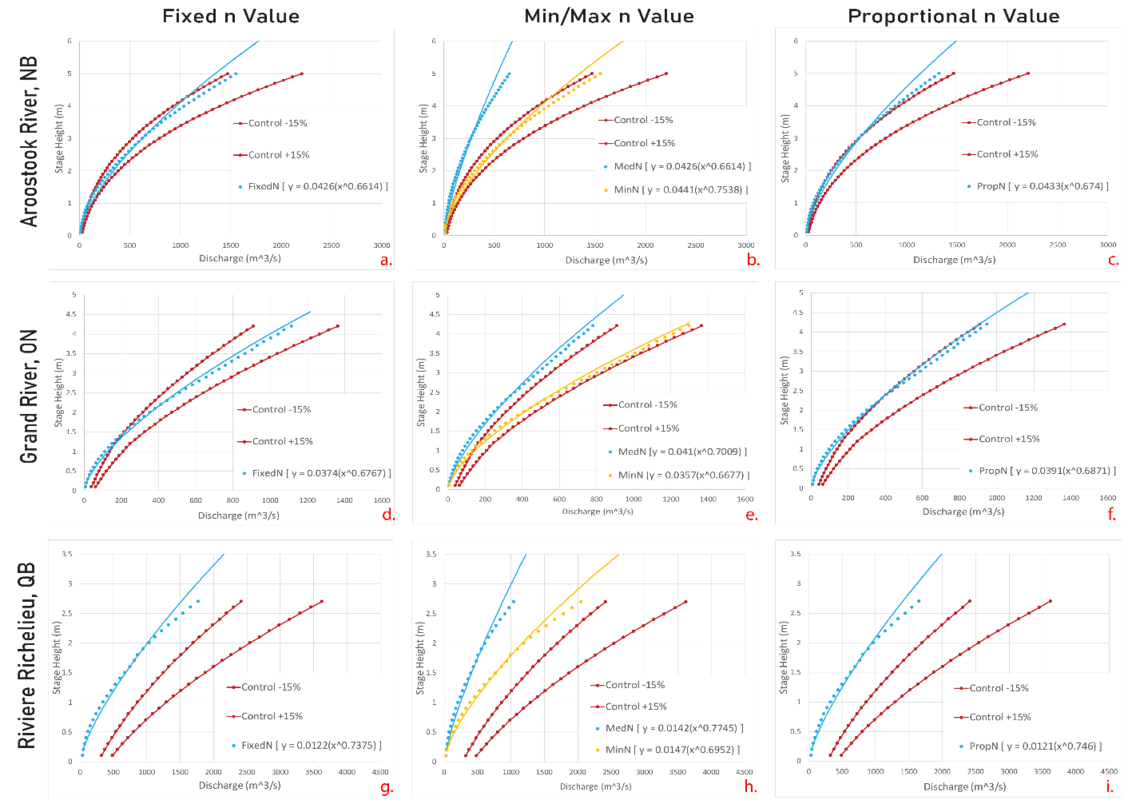
A custom ArcGIS tool, the CERC-HAND-D tool, was developed to create the SRC using all three methods. Control data was sourced from various gauge stations across Eastern and Central Canada in the form of rating curves. Results indicate that CERC-HAND-D creates more accurate SRCs (NRMSE = 5% - 16%; Percent Bias = -3.9% - 22%) in areas with medium to medium-high river gradients (S>0.002 m/m), especially using the minimum-maximum n value method. Results also indicate that CERC-HAND-D may not be suitable for areas with low river gradients (S<0.002 m/m) or with river reaches much larger than 3 km (NRMSE = 18.9% - 56%; Percent Bias = 22.7% - 101%). These results show promise for utilizing SRC, and we are currently in phase two of our project where we are developing the on-the-fly flood map web application with SRC integration.

Figure 2. The results of our SRC tests using the three methods of deriving the manning's roughness coefficient (n); the red SRCs are the control data with a ± 20% acceptance range. The results shown in a-f represent sites with medium river slopes (∼ 0.002) and river reaches shorter than or around 3 km. The results shown in g-I represent a site that had a river reach much larger than 3 km. Note: not all results were shown.
Funding sources: Natural Resources Canada, Land and Minerals Sector (LMS) Innovation Fund; and Schulich School of Engineering Research Funds.
Collaborators: Natural Resources Canada
Software: The code for the custom ArcGIS tool is available for download at https://github.com/blairscriven/CERC_HAND_D.
Video:
*note: This is the prototype video for our web application. The final product may look different and have different features.
Publications:
- Zheng, X., D.G. Tarboton, D.R. Maidment, Y.Y. Liu, and P. Passalacqua. 2018. “River Channel Geometry and Rating Curve Estimation Using Height above the Nearest Drainage.” Journal of the American Water Resources Association 54 (4): 785–806, doi: https://doi.org/10.1111/1752-1688.12661.
- Godbout, L. D. 2018. "Error assessment for Height Above the Nearest Drainage Inundation Mapping", Master of Science in Engineering thesis, The University of Texas at Austin, https://repositories.lib.utexas.edu/handle/2152/68235.
- McGrath, H., Bourgon, J.-F., Proulx-Bourque, J.-S., Nastev, M., and Abo El Ezz, A. 2018. “A comparison of simplified conceptual models for rapid web-based flood inundation mapping.” Natural Hazards, 93, 905–920, doi: https://doi.org/10.1007/s11069-018-3331-y.
- Zheng, X., Maidment, D. R., Tarboton, D. G., Liu, Y. Y., & Passalacqua, P. (2018). GeoFlood: Large-scale flood inundation mapping based on high-resolution terrain analysis. Water Resources Research, 54, 10,013–10,033, doi: https://doi.org/10.1029/2018WR023457
- Garousi-Nejad, I., Tarboton, D. G., Aboutalebi, M., & Torres-Rua, A. (2019). Terrain analysis enhancements to the height above nearest drainage flood inundation mapping method. Water Resources Research, 55, 7983–8009, doi: https://doi-org.ezproxy.lib.ucalgary.ca/10.1029/2019WR024
- Vatanchi, S. M., & Maghrebi, M. F. (2019). Uncertainty in Rating-Curves Due to Manning Roughness Coefficient. Water Resources Management, 33(15), 5153-5167, doi: https://doi.org/10.1007/s11269-019-02421-6
